Monitoring a computer system is equally as crucial as the system itself. Network monitoring enables proactive reaction, data security, data collection and overall computer system health. However, implementing monitoring tools is done to ensure the performance of computers and network services, not to resolve system problems. The majority of network monitoring software keeps a constant eye on a network. Thanks to the tools’ proactive capabilities, it is simple to detect and inform the organization about performance concerns before the network team notices them. These tools shorten the time it takes to address a problem. Furthermore, network monitoring tools allow for the discovery of all network issues, even the smallest ones, before they compound into bigger ones.

Consequently, numerous monitoring tools exist that visualize network performance to allow for adequate network monitoring and making efficient decisions. The best network monitoring tools are discussed below:
Table of Contents
1. SolarWinds Network Performance Monitor
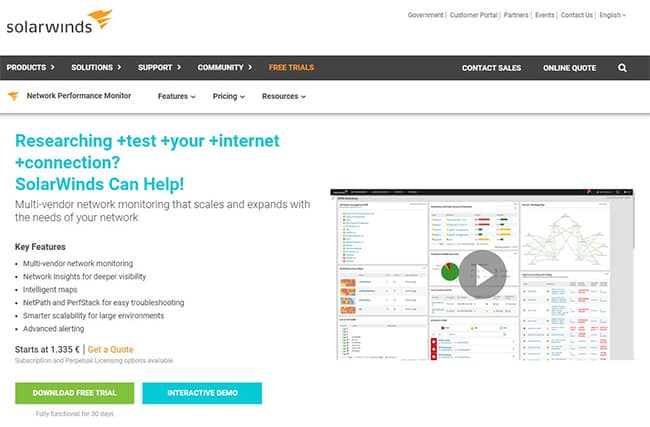
SolarWinds Network Performance Monitor (NPM) is a feature-rich and cost-effective network monitoring solution that rapidly detects, diagnoses and resolves network performance issues and outages. SolarWinds Orion NPM monitors network and endpoint devices, as well as office equipment like printers. With the help of its built-in features, the SolarWinds monitoring tool can keep track of the health of networked devices.
These are some of the features and benefits of SolarWinds NPM that make it a practical and functional tool for network monitoring:
- Data correlation across stack networks: This is a drag-and-drop network performance measurement on a standard timeline that allows instant visual correlation across all network data to speed up underlying cause discovery.
- Dependency-aware intelligent notifications and a customizable topology.
- Step-by-step analysis of essential routes: With NetPath, it is simple to see the performance, traffic and configuration data of devices and applications on-premises, in the cloud or in hybrid settings.
- Monitoring for faults, performance and uptime: With network optimization software, you can swiftly detect, diagnose and resolve network performance issues while avoiding downtime.
- Constant scrutiny of F5 BIG-IP: This allows businesses to see and understand the health and performance of their F5 service delivery environment.
- Forecasting, warning and reporting automated capacity: This model calculates depletion dates based on peak and average consumption using customizable thresholds.
- Finding and mapping of dynamic wired and wireless networks: SolarWinds NPM automatically finds and maps devices, performance indicators, link utilization and wireless coverage.
- Monitoring and control of wireless networks: Performance measurements for autonomous access points, wireless controllers and clients are retrieved using this functionality.
- Network monitoring software with a customizable single pane of glass: This function generates web-based network performance dashboards, views and charts that can be customized to better understand network status.
Also, practical node analysis, a comprehensive dashboard that is easy to customize and a relatively basic map editor are just a few of the distinctive features of SolarWinds NPM.
Some unique properties of SolarWinds NPM are listed below.
- SNMP monitoring
- Network packet analysis
- Intelligent network maps with NetPath
- Automatic discovery of connected network devices
- Alerts system
- Reports system
- WiFi heat maps
Advantages of using SolarWinds NPM are listed below.
- This tool notifies organizations about performance issues, allowing quick intervention before end-users and business services are harmed.
- SolarWinds NPM is simple to use and can assist with diagnosis and troubleshooting.
- Even after hours, alerts can be automated to indicate abnormalities.
- The graphical user interface is appealing.
Disadvantages of SolarWinds NPM are listed below.
- There are a lot of advanced features that are missing.
- Some devices aren’t supported.
- The service is expensive.
- Working around automation could be difficult for a beginner.

When it comes to the pricing of SolarWinds NPM, the Network Performance Monitor is only available as a one-time purchase. There are not any different packages with various sets of features. The system’s price points rise in proportion with the scale of the network on which it will operate.
The number of elements determines the network’s size. The factors with network characteristics determine the price of the whole package that suits an organization. Consider the following network characteristics:
- Interfaces: These are switch ports and both physical and virtual interfaces, such as VLANs.
- Nodes: This is a count of network equipment, such as switches, routers, network access points and servers.
- Volumes: This refers to the logical disks that are being monitored.
These are the available price plans for each element and network characteristics considered:
| Plans | Number of elements | Price |
|---|---|---|
| NPM SL100 | 100 | $2,955 |
| NPM SL250 | 250 | $6,720 |
| NPM SL500 | 500 | $10,445 |
| NPM SL2000 | 2000 | $19,345 |
| NPM SLX | No limit | $32,525 |

Installing SolarWinds NPM is fairly simple thanks to the installer. An installer wizard, known as Orion Installer, guides users through every step to get the monitoring tool downloaded and installed. SolarWinds customers can log in to the Customer Portal. Look for the Network Performance Monitor under Recent Downloads for your Products.
Choose the option that allows you to register as a new customer who wishes to take advantage of the free trial. Download the 30-day free trial from the SolarWinds website’s NMP trial page. Complete the registration form and click the Download Now option. This is where you can get the installer. Follow these steps to download the SolarWinds NPM:
- To download the online or offline installer, click Download. If the server is connected to the internet, select Online. If you want to move the downloader to a system that is not connected to the internet, select Offline.
- Save the installer file to your computer.
- Run the installer.exe file as an Administrator on your server. The installer will display a Welcome page.
- Choose from Lightweight Installation, Standard Installation and Adding a Scalability Engine for your installation. Select the Standard Installation option.
- Set the folder that will be used as the destination.
- Click Next. You will then be taken to the Choose Products page.
- To install, choose Network Performance Monitor.
- Register your language for consideration.
- Continue by pressing the Next button. You will eventually arrive at the Install Report page. This is a screenshot of the System Check Results.
- Make sure the report does not have any Critical Issue points. Informational and cautionary messages are no turnoffs.
- Click on the Details link on that line of the report if there is a critical issue. After you have resolved the issue, click Run Checks Again.
- Continue by pressing the Next button.
- Examine the contract and the Terms of Service (EULA). After that, click Next.
- Keep an eye on the installation as it happens. During the installation, a reboot may be required.
- On the page that says “Completing the Orion Configuration Wizard,” click Next.
- After you have finished configuring the Orion Web Console, click Finish to start using it.
- Use the admin username to log in to the console. For the admin account, create a password, confirm it and then click Save & Login.
Note:
SolarWinds NPM can be installed on Microsoft Windows Server, Microsoft Windows (trial evaluation only), macOS, Red Hat Enterprise Linux (RHEL), CentOS, Fedora and Java Platform.2. Datadog Network Performance Monitoring
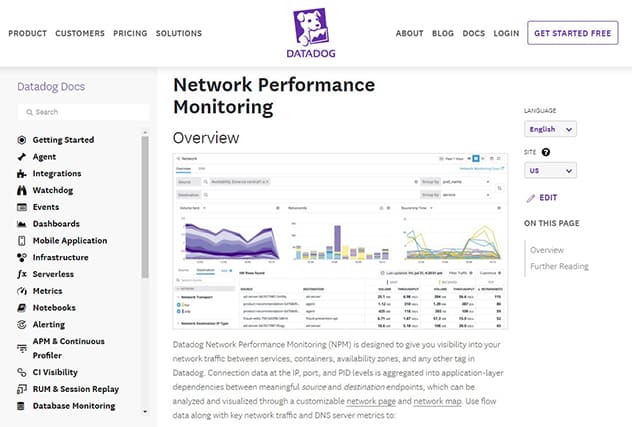
Datadog Network Performance Monitoring (NPM) is a network monitoring solution that allows users to see network traffic between services, containers, availability zones and any other Datadog tag. It provides complete insight into on-premises and cloud networks and application-layer performance, and bare-metal appliance health.
Datadog contains unique built-in features that advance its functionality. These are some of Datadog’s features and benefits discussed below:
- Real-time network mapping and analysis with Network Performance Monitoring: This feature examines traffic as it moves between apps, availability zones and on-premise servers. This functionality can help diagnose cross-pod communication issues, rectify inefficient load balancing and identify the services and teams responsible for unusual traffic spikes.
- Analysis of network traffic between meaningful endpoints, not just IPs: At the app, IP, port and PID layers, network analysis aids in monitoring the health of traffic between any two endpoints. Datadog measures critical network metrics, including TCP retransmits, latency and connection churn by observing traffic between services, pods, cloud regions and cloud resources.
- Deep visibility into DNS performance: This functionality uses request volume, response time and error code metrics to assess DNS server health. Deep visibility also distinguishes between client-side code problems and DNS issues on the server.
- Health and performance insights into any on-premise device: With compatibility for brands like Cisco, HP, Dell, F5, Juniper and others, Datadog can easily auto-discover any device on any network or subnet. The health insight provides aggregate metrics for all devices by location and the ability to quickly drill down to see the health of specific interfaces.

Also, Datadog uses machine learning-based notifications to monitor device health, forecast bandwidth usage proactively and notify users before problems develop.
Datadog is used to assist digital transformation and cloud migration by businesses of all sizes and across various sectors. For mid-sized IT organizations, Datadog is an excellent network and service monitoring solution. Once users get past the initial setup and the agent-based architecture, it has a lot to offer including various integrations, dashboards and customizable alerts.
Advantages of using Datadog NPM are:
- The track-keeping feature helps with various database types and their infrastructure.
- Easier to go back in time and look at metrics.
- Straightforward to manage downtime for multiple resources.
Disadvantages of Datadog NPM are:
- The service can be costly.
- For beginners, Datadog is a bit overwhelming to use.
- It can be time-consuming to build a dashboard from the ground up. While it can be simple to set up for a seasoned user, beginners may have some issues getting started.
The pricing of Datadog depends on the user’s plan and the number of containers for each host being used. This is the pricing list of different plans:
| Name | Price |
|---|---|
| Free | $0 per host, per month |
| Pro | $15 per host, per month |
| Enterprise | $23 per host, per month |
To install Datadog NPM, complete the following steps:
- It is suggested that users fully install the Agent before downloading Datadog.
- For Amazon Linux, CentOS, Debian, Fedora, Red Hat, SUSE and Ubuntu, a standalone DogStatsD package is available. This package is used in containerized settings where DogStatsD is used as a sidecar or in contexts where a DogStatsD server is used but does not have full Agent capability.
- Select your preferred platform to begin using the Agent.
- Datadog advises that users update Datadog Agent at least once a month or after every minor release and patch release.
Note:
Datadog NPM is compatible with platforms such as Windows, Linux, macOS, Debian, Ubuntu, CentOS/RedHat, Fedora, CoreOS, Docker, Kubernetes, Openshift, SmartOS, Chef, Puppet and Ansible.3. ManageEngine OpManager
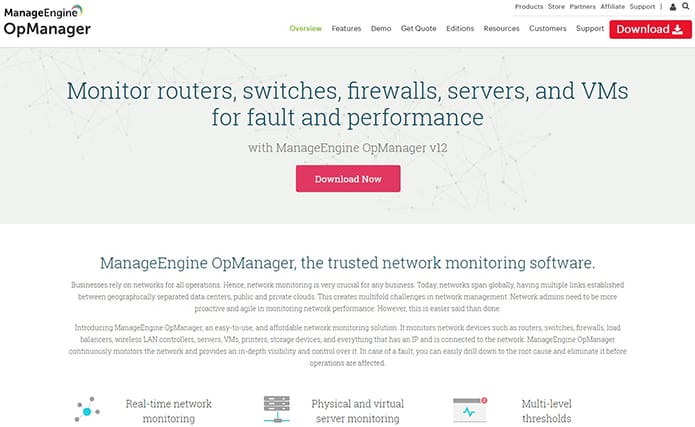
ManageEngine OpManager keeps a constant eye on the network and gives complete insight and control over the web. This tool makes it easy to dive down to the underlying source of a problem and eliminate it before operations are harmed.
ManageEngine OpManager is a network management solution that combines network and server monitoring, bandwidth analysis, configuration management and fault management in an easy-to-use and economical package. This solution is appropriate for companies of all sizes.
The network management solution is designed with features that enhance OpManager’s effectiveness and functionality. These are some of the features and benefits of ManageEngine OpManager:
- Instant network monitoring: OpManager monitors network health along with crucial metrics like packet loss, latency, speed, errors and discards. OpManager also analyzes performance bottlenecks, with over 2,000 built-in network performance monitors.
- Physical and virtual server monitoring: OpManager keeps track of how much CPU, memory and disk space Windows and Linux servers use. OpManager also monitors VMware, Hyper-V, Xen and Nutanix server virtualization technologies’ hosts and virtual machines (VMs) performance.
- Multi-level thresholds: ManageEngine OpManager uses multi-level criteria to proactively monitor network performance. Users need to select several criteria and receive fast alerts for violations to acquire every critical performance monitor.
- WAN link monitoring: To eliminate network difficulties, ManageEngine’s monitoring tools track critical metrics such as latency, jitter, RTT and packet loss.
- Customizable dashboards: Users may quickly review basic dashboards or construct custom dashboards with the assistance of over 200 performance widgets which allow users to view network performance at a glance.
- Affordable and easy setup: OpManager requires no expensive consultation or training. It is the only network monitoring software with a clear device-based price plan.

OpManager, a cross-enterprise IT network management software, provides a single method for scaling and managing multi-vendor company IT networks. It gives users detailed insight into the performance of essential IT resources including network devices, WAN or VoIP connections, servers, virtual servers, switches, etc.
Advantages of ManageEngine OpManager are:
- User-friendliness in terms of interface, simplicity and precision.
- Valuable tools for monitoring.
- Device auto-discovery.
- Installation and configuration are simple.
- Monitoring of the network in real-time.
- Software that manages bandwidth traffic in an easy-to-use manner.
Disadvantages of ManageEngine OpManager are:
- Time-consuming to set up alerts, thresholds and other features.
- Expensive.
- For new users, the interface can be confusing.
- Updates are published regularly, resulting in a significant amount of downtime when upgrading.
With a one-time payment, the cost of ManageEngine OpManager starts at $245 per feature. ManageEngine OpManager Plus, on the other hand, starts at $715 for a one-time purchase. The cost of upgrading to the Enterprise edition is $11,545. ManageEngine also provides a free trial of its software.
| Name | Price | |
|---|---|---|
| Standard Edition | $245 | For 10 devices |
| Professional Edition | $345 | For 10 devices |
| Enterprise Edition | $11,545 | For 250 devices |
There are some steps you need to take before you learn how to install ManageEngine OpManager. Before installing OpManager, make sure the computer meets the system requirements. Having double-checked the criteria, visit the ManageEngine website to get the software. Follow these procedures to obtain application plug-ins:

- Before installing the plug-in, turn off OpManager.
- Double-click the APM plug-in .exe file in OpManager. Only the APM plug-in needs to be installed on the OpManager server.
- To finish the installation, follow the on-screen directions.
- Click the Finish button. The plug-in has now been successfully installed.
ManageEngine works comfortably with Windows (2003 Server, Vista, 2000 professional +SP4, XP Professional) and Linux (RedHat 7.x and above, Debian 3.0, Suse, Fedora & Mandrake).
4. Site24x7 Network Monitoring
Users can easily comprehend network activities by visiting Site24x7. Network performance and monitoring are simple using insights. Organizations may use a map to visualize the network hierarchy, track critical and custom performance indicators, examine a health dashboard, watch NetFlow and use quick SNMP trap notifications to fix network issues. Users can also utilize this cloud-based network monitoring application to acquire comprehensive network control.
Site24x7 is a multi-vendor, cloud-based and scalable real-time network monitoring software that continuously monitors users’ networks and helps them avoid disruptions. This network monitoring tool’s high availability and outstanding characteristics aid in the uninterrupted monitoring of networks. These are some of Site24x7 features and benefits:
- Routine monitoring: With reliable data on network activities and router traffic sources provided by Site24x7’s router monitoring software, it is simple to visualize and swiftly rectify router problems. Users can also monitor the availability and performance at the interface level for in-depth router monitoring from the cloud.
- Firewall monitoring: Firewall monitoring analyzes critical firewall monitoring data like traffic, bandwidth consumption and sessions to secure network firewalls.
- VPN monitoring: Site24x7 uses essential performance indicators like latency and tunnel flap to monitor VPN connections, pathways and tunnels. Site24x7 improves remote work and ensures that VPN equipment functions properly.
- Sensor monitoringSite24x7 is a network monitoring system based on the Simple Network Management Protocol (SNMP) that detects anomalies in real-time. A secure, firewall-friendly architecture also ensures the uptime and fault management of all users’ SNMP devices.

When a device agent identifies a critical situation on the device being monitored, SNMP includes a mechanism that allows sending a notification to the manager. Site24x7’s dashboard converts this communication into a warning or an alert based on the severity rating provided on the message from the agent.
Other unique properties of Site24x7 are:
- Automatic network discovery.
- Application and network device monitoring in real-time.
- Effective reporting, analytics and notifications.
- Full-stack monitoring.
Advantages of Site24x7 are:
- The Web Console is easy to use. This is also critical in attempting to review and establish where problems may exist.
- Functionality for administration. This is an intuitive procedure.
- The mobile app is ideal because it allows users to reply to notifications in seconds.
- Excellent for monitoring server or website performance.
- Teams can use a free demo to examine the health of their servers and network equipment.
- One of the most user-friendly network monitoring software programs on the market.

Disadvantages of Site24x7 are:
- The setup and a few features have a level of intricacy that can be tough.
- Comprehensive platform, similar to the other tools higher on this list. Learning all of its features and settings might take some time.
In addition, both free and premium website monitoring services are available through Site24x7. Site24x7 offers a 30-day free trial. Therefore, to continue enjoying the Site24x7 monitoring service, users will need to subscribe and pay. Here is the pricing list to help users decide on a plan that suits their organization’s needs.
| Plans | Price | Terms |
|---|---|---|
| Starter | $9.00 | 10 monitors |
| Pro | $35.00 | 40 monitors |
| Classic | $89.00 | 100 monitors |
| Elite | $225.00 | 250 monitors |
| Enterprise | $449.00 | 500 monitors |
| Enterprise Plus Web | $899.00 | 2500 monitors |
Use the following steps to learn how to install Site24x7:
- Go to Server > Server Monitor > Servers (+) > Windows on Site24x7.
- Select Download Site24x7 Windows Server Agent from the drop-down menu. Double-click the.msi file to install it. Select Next.
- In the field provided, type the device key. Users can find their device key on the web client’s Add Windows Monitor page.
- Check the Enable Proxy option if a proxy configuration is required to access the Site24x7 domain. Enter the server name, port number, username and password in the appropriate fields.
- To save the agent, choose an installation folder. Ensure that the folder has read and write access for multiple servers. Select bulk installation when installing the agent.
- View the monitor under Server > Server Monitor > Servers when the agent has been successfully installed.
- A tray icon will display in the Quick Launch Bar or under Start > All Programs > Site24x7 Windows Monitor > Tray Icon.
It is essential to take note of a few points while setting up Site24x7. First, understand the services that the Windows server monitoring agent installs. Also, make sure that the antivirus scanner exempts the whole Site24x7 installation directory.
Site24x7 is a network monitoring tool that does it all. Site24x7 can monitor various types of infrastructure, including physical, virtual and cloud infrastructure, online and mobile apps, intranets and internet applications. Amazon Web Services (AWS), Microsoft Azure and Google Cloud Platform are all supported by Site24x7.
5. Paessler PRTG Network Monitor
Paessler PRTG Network Monitor is a network monitoring tool that assists organizations in ensuring that their computer systems are working correctly and without disruptions. Network monitoring is also necessary for improving network efficiency by determining bandwidth and resource usage. PRTG includes features that can assist businesses in monitoring anything they need to monitor. Here are the primary characteristics of PRTG:
- Flexible notifications: PRTG has more than ten built-in technologies including email, push notifications, playing alarm audio files and triggering HTTP requests. SMS text messaging and .exe file execution are also supported by PRTG on-premises. Even when using a mobile device, the free push notifications keep users informed. Users can customize the notification system and set up alerts to meet their needs.
- Multiple user interfaces: The fully functional web interface is built on AJAX with high-security requirements, Single Page Application (SPA) technology and a responsive design that efficiently adapts to users’ systems. PRTG also offers desktop software that may be used with multiple PRTG installations. SSL-secured local and remote access can be used simultaneously through the user interfaces.
- Collective failover solution: Failover tolerant monitoring is possible with PRTG Network Monitor. When the cluster’s primary master is not connected or is down, another node takes over all of its functions, including delivering notifications.
- Maps and accessible dashboards: Real-time maps with basic status information can help organizations visualize their networks. This feature allows businesses to customize their map with unique HTML. Users can also share a map by putting its unique URL on a dashboard that is only accessible within the company’s LAN or outside the company if needed.
- Distributed monitoring: With PRTG Remote Probes, administrators can monitor several networks in different locations as well as independent networks within the firm. Organizations can keep an eye on customers’ networks and improve service quality.
Other unique properties of Paessler PRTG Network Monitor are:

- SNMP monitoring.
- Bandwidth monitoring.
- Custom dashboards.
- Threshold-based alerts system.
- Customizable network maps.
- Scan for network devices by IP segment.
- In-depth report system.
Advantages of Paessler PRTG Network Monitor are:
- The installation of PRTG is straightforward.
- Various features can be highly customized.
- Technical concerns, user behavior and business metrics can all be bridged using user monitoring.
- Automatic updates.
- Monitoring nearly anything that is connected to the internet.
- Flexible monitoring options.
- A trial version of the software is available.
- In a single glance, users can understand the reporting graph.
- Discovers devices using real-time data and creates charts, network maps and inventory reports.
Disadvantages of Paessler PRTG Network Monitor are:
- If users are not tech knowledgeable, the interface can be tough to navigate.
- Setting up a hierarchical structure can take some time.
- This is a sophisticated platform, just like other monitoring programs, and it will take some time to understand all of the monitoring tools’ features and settings.
Paessler PRTG Network Monitor offers a 30-day free trial for users. There are different pricing plans to consider if you decide to get the paid version depending on your organization’s needs.
| Name | Price | Terms |
|---|---|---|
| PRTG 500 | $1,750 | Perpetual license |
| PRTG 1,000 | $3,200 | Perpetual license |
| PRTG 2,500 | $6,500 | Perpetual license |
| PRTG 5,000 | $11,500 | Perpetual license |
| PRTG XL 1 | $15,500 | Perpetual license |
| PRTG Enterprise | Custom Pricing | Subscription |
Follow these steps to learn how to install Paessler PRTG Network Monitor:
- Install PRTG Network Monitor on a Windows PC by downloading it from the Paessler website.
- Log in to the Paessler shop on the website to buy, upgrade or renew maintenance.
- Double-click the setup file on the system you want to use as the PRTG core server to install PRTG. Install the software by following the installation wizard’s instructions.
- The auto-update feature will download and install new software versions after PRTG is installed.
- Once the installation is complete, open the PRTG web interface with one of the supported browsers, such as Google Chrome 72, Mozilla Firefox 65 or Microsoft Internet Explorer 11.
Note:
Paessler PRTG supports devices such as Microsoft Windows Server 2019, Microsoft Windows Server 2016, Microsoft Windows Server 2012 R2, Microsoft Windows Server 2012, Microsoft Windows 10, Microsoft Windows 8.1, Microsoft Windows 8, Microsoft Windows 7 and Microsoft Windows Server 2008 R2.6. Zabbix

Zabbix uses SNMP and IPMP and is an open-source monitoring software application for networks, servers, virtual machines (VMs) and cloud services. The auto-discovery feature locates network devices and adds them to the monitoring list automatically. Users can also use the program to automatically identify configuration changes, allowing them to see if a network device has been updated. Some features of Zabbix and their benefits are discussed below:
- Flexible data collection: The aggregate of traffic between two ports on a network switch can be calculated using Zabbix. This function also allows the user to preprocess the data acquired.
- Proactive network monitoring: It is simple to predict network outages, estimate bandwidth usage trends and discover anomalies in network traffic with Zabbix’s features.
- High level of availability: In a network outage, organizations can utilize Zabbix’s proxy to collect monitoring data and create a redundant monitoring solution.
- Network monitoring template: Templating allows businesses to keep track of all metrics. Device configuration templates can also be used to clone and mass update thousands of similar network devices.
- Flexible notifications: This functionality allows notifications by email, SMS, jabber, custom scripts and messenger. Message content can be modified based on the receiver and the organization’s escalation history to ensure that the point of contact has all they need to reopen wisely.
Other unique properties of Zabbix are:

- Auto discovery feature.
- Server monitoring.
- Network monitoring templates.
- Automatic detection of configuration changes.
- Alerts system.
- Remediation.
- Flexible problem definitions.
- Event correlation.
- SNMP and IPMP monitoring.
- Various metric collection methods and protocols.
- Application monitoring.
Advantages of Zabbix are:
- Zabbix is a software solution that monitors the entire infrastructure in one location.
- Dashboards, maps, graphs and out-of-the-box designs that are highly customizable.
- A powerful alert system.
- API for integration with other systems.
- Flexible design can rapidly identify new devices and configuration modifications.
- Handy templates for quick insights.
- SMS, email, custom scripts and webhooks are all supported by this robust notification system.
Disadvantages of Zabbix are:
- The interface is not as user-friendly as Site24x7’s interface.
- Better alerting features, linked explicitly to reducing false positives, are something to work on.
- For new users, the degree of difficulty can be quite severe.

Zabbix, like many other monitoring programs, offers a free trial to users. The paid version costs $1,600.00 per year.
To learn how to install Zabbix, just follow the installation process. The installation process for Zabbix Server varies depending on the operating system. This is the step-by-step guide for installing Zabbix Server on Ubuntu.
- Create a LAMP (Linux, Apache, MySQL, and PHP) environment.
- Zabbix package repository configuration: Before installing Zabbix, it is an excellent option to have the Zabbix package repository configured and activated on the users’ system. Use the instructions below to finish the configuration. Before configuring this repository, make sure your operating system is up to date, and then choose the commands that match your operating system version.
Ubuntu 18.04 LTS (Bionic):
$ wgethttps://repo.zabbix.com/zabbix/4.0/ubuntu/pool/main/z/zabbix-release/zabbix-release_4.0-3+bionic_all.deb
$ sudo dpkg -i zabbix-release_4.0-3+bionic_all.deb
Ubuntu 16.04 LTS (Xenial):
$ wgethttps://repo.zabbix.com/zabbix/4.0/ubuntu/pool/main/z/zabbix-release/zabbix-release_4.0-3+xenial_all.deb
$ sudo dpkg -i zabbix-release_4.0-3+xenial_all.deb
- Install Zabbix Server: Run the following command to install Zabbix Server on your system after enabling the repository. Running this command will install Zabbix Server and MYSQL support on your system.
$ sudo apt-get update
$ sudo apt-get install zabbix-server-mysql zabbix-frontend-php zabbix-agent
- Create database schema
- Edit Zabbix configuration file
- Restart Apache and Zabbix
- Finish the installation

Now, the next step is to download Zabbix agent. Zabbix Agent is responsible for gathering all data from users’ servers to follow them. It is critical to install the agent on all remote systems that a company needs to monitor with Zabbix Server. These are the steps to get Zabbix Agent downloaded:
- Enable Apt Repository
- Install Zabbix Agent
- Configure Zabbix Agent
- Restart Zabbix
Note:
After installing Zabbix Server and Zabbix Agent, the final step is to add a host to the Zabbix Agent that needs to be monitored. Zabbix software can monitor Linux, macOS, HP-UX, Solaris and other operating systems. Windows monitoring is only available via agents.7. Obkio
Obkio is a connection-oriented performance monitoring SaaS service that allows businesses to keep track of their network’s health at all times. Obkio’s network performance monitoring tool sends synthesized traffic from decentralized network monitoring agents placed at critical points throughout the user’s network. Obkio then gathers and broadcasts all network performance data to the user’s Obkio dashboard, alerting the user to any issues as soon as they occur.
Here are the features of Obkio that make it distinctive in function and efficiency:
- Synthetic traffic: Obkio’s Network Monitoring Agents exchange UDP traffic to monitor network performance once the network performance monitoring capability is set up. This low-volume traffic is both non-intrusive and highly secure. Furthermore, this feature does not necessitate packet capture, ensuring that users’ privacy is protected and that no changes to device setups are required.
- Decentralized network monitoring: Obkio’s approach is decentralized, allowing measurements between any pair of agents regardless of location or distance. This is because agents are deployed at critical network sites.
- Baseline and history: Obkio’s network performance monitoring solution captures performance data, allowing customers to go back through time and construct a network performance baseline with a one-minute accuracy. Users can even go backward in time to fix previous network problems.
- Instantaneous network monitoring: Unlike other systems, Obkio’s Network Performance Monitor continually monitors network performance rather than performing periodic tests at different times. Obkio uses this method to quickly discover irregular network faults.
- Automated speed tests: Speed tests place demand on the network to ensure that everything is working well. They will alert users if any portion of the network or equipment is not working correctly. Maximum test output is determined by the hardware on which the agent is installed and can range from 1 to 10 Gigabits per second.

Unique features of Obkio are:
- QoC monitoring.
- Traceroutes.
- VoIP measurement.
- Automatic speed test.
- Baseline and history.
- Instantaneous network monitoring.
- Synthetic traffic.
Advantages of Obkio are:
- A dashboard that is easy to understand.
- Excellent graphical user interface.
- The dashboard and real-time monitoring are ideal for diagnosing internet speed issues between remote sites.
- Obkio highlights the source of the problem.
- Obkio provides essential site-to-site availability monitoring and graphs, making it simple to set up and use.
- Traceroutes are a valuable tool for transitory path modifications.
- The customized dashboards are one of Obkio’s best features. They allow consumers to acquire all the information required on a single screen.
Disadvantages of Obkio are:
- Obkio is expensive.
- The features might need to be improved for more accessibility and options.
Furthermore, Obkio offers a 14-day free trial that includes all premium features. Obkio is also available on a paid basis for users to keep using it once the trial expires. Obkio’s pricing plans are listed below:
| Plans | Price | Terms |
|---|---|---|
| Free | $0 | 1 user |
| Basic | $29 per month | 2 users |
| Premium | $39 per month | 5 users |
| Enterprise | Personalized plan | 25+ users |
To learn how to install Obkio, complete the following steps. First, it is crucial to download the network agents. There are four network agents: software, hardware, public and virtual appliances. Different network agents are needed for other locations. These are the steps to install Obkio:

- Sign up for an Obkio account on the top right side of the website.
- With your email and password, select a preferred public network agent.
- The agent will be automatically updated once installed, but it is the user’s responsibility to keep the OS secure and up to date.
- Create a monitoring template.
- Fill in your specifications for the monitoring templates.
- Organizations can modify the monitoring templates and the network agents.
Note:
Obkio is compatible with CentOs, Ubuntu, Fedora and Debian.8. LogicMonitor
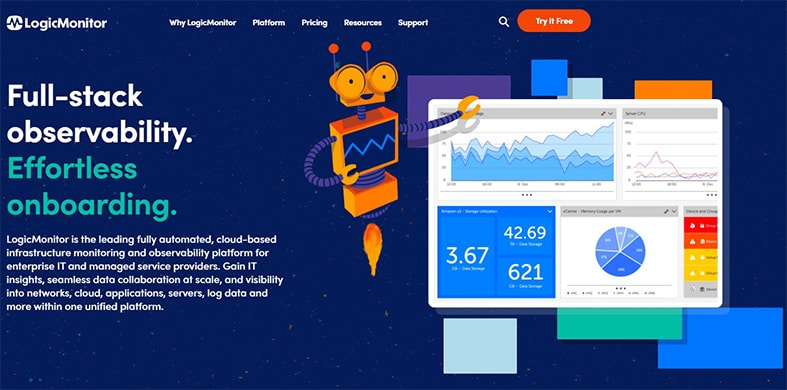
LogicMonitor is a general-purpose server monitoring tool that may be used in a variety of situations. LogicMonitor monitors various servers including WEB, WEB API, SVC, RPT, SQL and others. For IT and managed service providers, LogicMonitor is an entirely automated cloud-based infrastructure monitoring and observability platform. Businesses can receive IT analytics, seamless data collaboration at scale and visibility across networks, cloud, apps, servers, log data and more within one single platform.
LogicMonitor has unique built-in features such as:
- Agentless monitoring: Unlike standard agent-based monitoring systems, which require the installation of an agent for each device being monitored on a network, this solution does not require an agent for each device being monitored. LogicMonitor requires a single data collector running on a Windows or Linux computer within the user’s firewall.
- ActiveDiscovery: ActiveDiscovery is a LogicMonitor feature that automatically monitors newly added devices, allowing worry-free updates to monitoring tools. Organizations know that the newly-added devices will be observed right away, reducing manual configuration and the risk of human error. Interfaces, physical disks, volumes, temperature sensors, virtual IPs, VPN linkages, apps and more are all monitored once a device is detected.
- Data security: Users may see previous trends, detect consumption patterns and forecast potential growth requirements with LogicMonitor, which can keep data for a year.
- Continuous alerts: If an issue is discovered, alerts are issued by email, phone call, text message, webhooks or the web. Signals can also be sent to different groups based on escalation rules for device type, nature of the issue and time of day.
- Multi-site monitoring: LogicMonitor keeps track of several websites at the same time and organizes them into dashboards.
Unique properties of LogicMonitor are:
- Multi-channel alerting.
- Multi-network capability.
- Compatible with mobile apps.
- Data security.
- ActiveDiscovery.
- Agentless monitoring.

Advantages of LogicMonitor are:
- The built-in notifications are quite helpful. All alerts are activated by default.
- The time-series database excels at delivering both precision and extended patterns.
- Custom aggregations and reports can easily be created using the dashboards.
- LogicMonitor allows users to monitor a wide range of devices and environments in great detail and with incredible accuracy.
- Automatic discovery of new infrastructures.
- LogicMonitor contains graphs that provide real-time and historical performance metrics for server CPU, memory, disk and network utilization.
Disadvantages of LogicMonitor are:
- At first, setting up alerts can be difficult.
- Expensive because the expense of each device might pile up.
- The report creation feature is limited.
- Some data sources can be too basic at times.
LogicMonitor offers a free trial and a premium version for users. There are different payment plans to get the best out of LogicMonitor. Here are the pricing plans:
| Name | Monthly Pricing |
|---|---|
| Starter | $15 per device |
| Pro | $18 per device |
| Enterprise | $20 per device |
To install LogicMonitor, complete the following steps:
- Decide where to install the Collector.
- The Collector can be installed on Windows or Linux.
- Install the Collector on a CPU with at least 2GB to 8GB of memory.
Note:
LogicMonitor is compatible with mobile apps like Android and iOS, Azure, AWS and GCP.9. Icinga

Icinga is an open-source extendable network monitoring tool that can monitor applications and services using object-based configurations. The program is web-based and may be configured using a graphical user interface (GUI) or a domain-specific language (DSL). With the option to choose between the two, consumers can monitor according to their preferences. The six basic strengths of the Icinga stack encompass all elements of monitoring. These are the features and benefits of Icinga discussed below:
- Infrastructure monitoring: This tool helps businesses keep track of all of their IT in one spot. Organizations can also collect and analyze data from their IT infrastructure to improve business outcomes and accelerate value development.
- Monitoring automation: This type of automation handles a company’s workload with ease, increases speed and lowers error rates. Icinga also makes it possible to use automation in a variety of ways.
- Cloud monitoring: Users can use a single tool to monitor the entire cloud architecture. In one monitoring solution, organizations will be able to monitor private, public and hybrid clouds.
- Metrics and logs: Users can rapidly collect data and evaluate system performance for quick troubleshooting and capacity planning.
- Analytics: Organizations can use this functionality to examine data and take preventive actions. Users can get a quick overview and deep insights with Icinga.
Unique properties of Icinga are:

- Integration with other tools.
- Metrics and logs.
- Monitoring automation.
- Cloud monitoring.
- Notifications.
- DSL configuration is available.
- Dashboard.
- Web traffic reporting.
Advantages of Icinga are:
- Compatible with both Linux and Windows.
- Visual reporting is built-in.
- Modules provide a variety of functions while keeping the base installation simple and light.
- Icinga may be set using a GUI or a DSL, creating a viable solution for administrators that prefer command-line tools.
- A transparent, open-source tool.
Disadvantages of Icinga are:
- The open-source community provides support and updates.
- The deployment of distributed configurations can be complex.
- Other solutions have better out-of-the-box features than Icinga.
To learn how to install Icinga, complete the following steps. Icinga web is required before downloading the Icinga monitor. Icinga 2 is the monitoring server and it needs Icinga Web 2 on top of it to give users a clear, convenient and pleasant view of what is going on behind the scenes. Icinga involves two stages and can be downloaded with the following steps:
Stage 1: Installing Icinga 2 on Ubuntu 20.04 and configuring it
- Update and install the necessary software.
- Icinga Package Repository should be added.
- On Ubuntu 20.04, install Icinga2.
- Set up plugins.
- Install MySQL|MariaDB and set up the database IDO MySQL.
- Enable the IDO MySQL module.
- Setup Icinga 2 REST API.
Stage 2: Setting up Icinga Web 2
- Add Package Repository.
- Install Icinga Web 2.
- Prepare web setup.
- Start web setup.
10. ConnectWise Automate
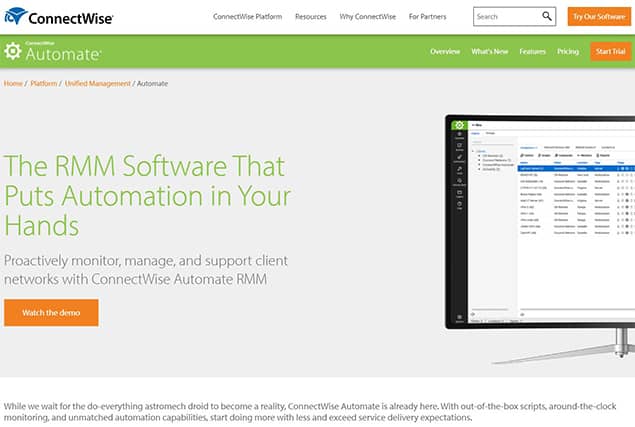
ConnectWise Automate is a remote monitoring application that allows IT professionals to work at a business pace. ConnectWise Automate provides everything an IT staff needs to shift from reactive to proactive IT assistance with solid automation and unrivaled monitoring. Any IT-related issue may be monitored, discovered and resolved with ConnectWise Automate RMM. Issues can be network bottlenecks, application performance difficulties or security concerns.
Organizations can do more and deliver better service with out-of-the-box scripts, round-the-clock monitoring and unrivaled automation capabilities. The essential features and benefits of ConnectWise Automate are discussed below:
- Remote monitoring: ConnectWise Automate allows organizations to monitor client endpoints, networks and PCs remotely and proactively. Remote session audit, agent and agentless monitoring and virtual machine monitoring are all included in ConnectWise Automate RMM, giving users all the capabilities they need to serve clients with IT services.
- IT automation: Organizations can optimize desktop and server management with ConnectWise Automate IT Automation’s out-of-the-box script functions. Organizations can monitor many devices, undertake preventive maintenance and even provide end-users with self-service choices. IT automation also allows employees to delegate administrative responsibilities like emailing scheduled reports, generating random passwords, updating custom data fields and conducting direct SQL queries to others.
- Extra technology insights: The reporting engine in ConnectWise Automate provides an eye-opening set of KPIs, including a complete picture of the technology controlled. Organizations will be able to determine what works and what does not for their most valuable customers.
- Endpoint management: ConnectWise Automate’s endpoint management features are designed to assist users with monitoring and managing all endpoint devices in their managed networks in real-time. Organizations will save time and money while maintaining a high level of service to consumers by automating general maintenance tasks related to PC health, security vulnerabilities, patches and updates. This functionality reduces downtime while increasing client satisfaction.
- More proactive support: TSP’s revenue stream relies heavily on time management. ConnectWise Automate solves typical IT problems, automates Tier 1 assistance and prevents recurring issues in client networks and endpoint devices before they become serious.

Unique properties of ConnectWise Automate are:
- Time-saving.
- Patch management.
- Endpoint management.
- Proactive support.
- Extra technology insights.
- IT automation.
- Remote monitoring.
Advantages of ConnectWise Automate are:
- The software offers a variety of connectivity options.
- Easy to set up and use.
- The tool’s dashboards provide overviews and thorough descriptions of KPIs.
- A large number of plugins available allows for extensive customization to meet users’ needs.
- Maintains security and serves as patching solutions.
- Smooth remote access to manage devices.
Disadvantages of ConnectWise Automate are:
- Maintaining software can be costly.
- Beginners may find ConnectWise Automate challenging to implement.
The pricing of ConnectWise Automate is dependent on the organization’s needs. There is different pricing for instant remote support, behind-the-scenes device monitoring and management and cybersecurity risk assessment software. Here is the pricing list for other plans:
For instant remote support:
| Plan | Price |
|---|---|
| One | $24 |
| Standard | $39 |
| Premium | $49 |
For behind-the-scenes device monitoring and management: This involves all-inclusive remote monitoring access.
| Unattended agents | Per month, annually | Per month, monthly |
|---|---|---|
| 25 | $30 | $38 |
| 50 | $53.33 | $67 |
| 100 | $100 | $125 |
| 250 | $200 | $250 |
| 500 | $375 | $465 |
| 750 | $525 | $660 |
| 1000 | $600 | $750 |
| 2500 | $1,250 | $1,575 |
Here is how to install Connectwise Automate:

- Open your browser and visit the ConnectWise website.
- Click on Resources on the homepage of the website and select “Start a Trial.”
- Scroll down and select the “ConnectWise Automate trial.”
- A page will open up, then fill in the form by entering your details including email address, business phone number and other information.
- After the form has been completed, click “Get my trial.”
- Another page will open up where trial configuration details should be entered. Check the box to signify agreement to all terms and conditions, then click “Start my trial.”
- A page will open up to download the control center. Click “Download control center” then save the file into a folder on your system.
- The file will automatically save and download. Wait a bit for an email notification to continue the installation. In the email, there are options for the server to choose from. Select the “Control server” option, run the file and save it.
- As part of the email content sent to users, there are login details attached. Click on the link and a configured page to enter more information will open up.
- Close the page, then open the file saved initially. Right-click on the file and choose “Run as administrator” then close it.
- Visit the credentials part of the email sent and copy the login details.
- Go to the “Start” section of your computer and type in “Automate control panel.” Right-click on it, choose to Run as administrator and click “Yes.”
- A login page will open. Copy the server URL, username and password in the email and paste them into the open form’s right section. Click “Log in.”
- The ConnectWise interface will open up and is now ready to be used for monitoring.
Note:
ConnectWise Control runs on Windows, macOS, Linux, Android and iOS.What Is Network Monitoring?

Network monitoring provides network administrators with the data needed to assess whether a network performs optimally in real-time. Administrators can use tools like network monitoring software to identify defects early on, boost performance and more. The capacity to detect problems now extends beyond the usual demarcation lines of the network. These systems can send email or text alerts to administrators and generate reports using network analytics.
This is important:
Network managers rely on network monitoring tools to swiftly discover device or connection failures and issues like data flow bottlenecks. Even without the network monitoring definition, the purpose of the monitoring tools can easily be spotted.Human error, configuration difficulties and environmental conditions are all elements that can affect organizations. Implementing network monitoring is one of the most fundamental and straightforward techniques to avoid outages in the first place. Additionally, network automation tools allow users to take things a step further. Not only can network monitoring detect problems, but these network monitoring tools can also automatically enable users to resolve problems proactively.
Furthermore, network monitoring also helps in identifying security threats. The most significant benefit is a picture of what “normal” performance for a company looks like, making it simple to notice anything out of the ordinary, whether it is a change in traffic or an unusual device connected to a user’s network. Users can take a proactive approach to network security by diving down to determine when and on what device an incident occurred.
What Are the Types of Network Monitoring Software?
There is a variety of network monitoring software on the market that highlight issues for businesses. The following are the various types of network monitoring software:

- Solarwinds Network Performance Monitor
- Datadog Network Performance Monitoring
- ManageEngine OpManager
- Site24x7 Network Monitoring
- Paessler PRTG Network Monitoring
- Nagios Core
- Zabbix
- Progress Whatsup Gold
- Icinga
- Spiceworks Connectivity Dashboard
What Should You Know Before Buying a Network Monitoring App?
Network monitoring uses various techniques to test the performance, availability and functionality of the network. However, it is essential to understand some key features of network monitoring apps before making a purchase. Here are some things to consider:
- Ping monitoring: Pings are one of the oldest and most extensively used monitoring techniques among NPMs today. They are a simple monitoring tool, but they are a good way for businesses to see if gadgets are up and running. The monitoring tool sends one or more packets to a device and waits for a response. The monitor knows the target node is up and running if it responds with an “all-clear” message. If no response is obtained, further pings are sent to capture the node’s attention. If the pings continue to yield no results, the monitoring tool notifies the user.
- SNMP monitoring: SNMP, a device protocol that offers monitoring tools and nodes with a standard language to communicate with one another, is now supported by the vast majority of devices. To deliver information to network management and monitoring tools, the system relies on agents embedded in devices. When a critical network event occurs, an SNMP manager sends out polls to devices to inquire about their present state, which can issue traps in response. Monitoring is centralized and simplified using NPMs that feature SNMP monitoring.
- Log file monitoring: Device log files include basic information, including any faults, that the device can report on. Some tools monitor log files to seek device-reported issues, although log file is not as sophisticated as other methods. Log files are plain text files containing keywords like “error” or “critical” that indicate a node problem. These keywords are searched for by monitoring systems and anything unexpected is reported.
- SQL query monitoring: SQL queries can be used by monitors to keep track of databases on a network. These queries request information from the database on the number of data requests, transmissions, etc. A database monitor can use this data to determine whether or not the database is working well. If the database is operating slowly, the monitoring tool can notice it and notify the network team.
- NetFlow monitoring: Packet traps are used by NetFlow systems to inspect traffic passing through a network segment. The NetFlow probes collect data about traffic and transfer it to a monitoring tool for examination. The research looks at network traffic flow and volume to figure out how data moves through the network. NetFlow and other flow-based monitoring solutions evaluate device dialogues to guarantee that data and information travel smoothly throughout the network path.
How Can Network Monitoring Software Help Me Optimize My Network Infrastructure?
Here are the advantages of network monitoring that might help your IT infrastructure:

- Faster resolution of problems: For time-pressed network operators, network monitoring makes problem solving simpler and faster.
- It can eliminate network infrastructure outages: Outages might be caused by human mistakes, configuration errors or environmental reasons. Implementing network monitoring is one of the most fundamental and straightforward techniques to avoid outages.
- Identifying potential security threats: The first layer of protection can be provided by a network monitoring tool. The most valuable benefit you receive is a picture of your company’s typical performance. Network tools make a change in traffic or an unfamiliar device connected to users’ networks easier to notice.
- Organize networks as they expand and change: The complexity of networks is increasing. Things are changing even more quickly than usual, with remote work and hybrid office arrangements becoming the norm. As a result, employing a network monitoring tool will help monitor networks more effectively.
- Implement new technologies and system updates successfully: New technology and services necessitate a financial commitment. This means that proving ROI on these projects is vital. However, without the capacity to monitor and manage your network environment, verifying if the project produced the promised benefits becomes challenging.
How to Choose the Best Network Monitoring Tool
Every network monitoring tool must be able to meet the requirements of an organization. As a result, various elements play a role in identifying the best network monitoring tool, as each tool has its own set of characteristics. These are some things to consider to choose a monitoring tool:

- Consider network security: Some network monitoring solutions include built-in network security features. However, these tools tend to be more performance-oriented than security-oriented. Organizations should think about what network security tools they already have and whether a monitoring solution can help the organization improve their security.
- Customization and ease of use: A network monitoring tool must be simple to use to be effective and to accomplish its objective. Purchased solutions have a distinct benefit in terms of implementation. Since all components are pre-built inside the monitoring tool, paid tools are easier to implement and customize.
- The flexibility of the tool: Networks are never static. They grow to meet the increasing number of nodes, users, devices, systems and traffic every year. As a result, it is critical to find a network monitoring solution that can increase its data collection and reporting capabilities to match the growing size of users’ networks and businesses.
- Active discovery feature: Specific applications provide built-in automatic discovery, which allows the service to use a full layer discovery scan to assess the network’s current condition. A performance monitoring solution with automated device discovery, for example, can gather and report on device type, vendor, serial number, hardware and firmware rev and other modules if your company adds a new network device. This ensures that the organization’s map is always kept current.
- Understand your business’ preference: Various companies have different reasons for using a network monitoring system because they have additional performance requirements and demands. When it comes to network monitoring solutions and providers, customers must first understand why their company needs to track network performance.
Pro Tip:
Your company may only need a solution to alert network unavailability. In this case, an in-depth monitoring solution may not be necessary and you may be able to get by with a simple tool.Can Bandwidth Monitoring Help With Network Security?

Bandwidth is one of the essential factors determining website performance. Similarly, bandwidth monitoring aids in detecting high and low traffic on a website. Doing so permits rapid response in the event of any abnormal bandwidth performance. In terms of network security, network administrators will be able to detect changes in website performance and determine if the website is under assault or if any other threats are present.
The amount of data that may be moved or downloaded from a website is referred to as bandwidth. Its definition is based on the number of bits per second (bps) that are traveling through the network. The measurement can be in kilobits per second (Kbps), megabits per second (Mbps) or gigabits per second (Gbps). 1 Gbps, for example, is 1000 Mbps, which is ten times faster than 100 Mbps.